
Brilliant gemstones: fluorescence and phosphorescence of diamonds, colored stones and pearls

SUMMARY
The use of photoluminescence imaging for gemstone characterization is reviewed, considering both fluorescence and its delayed counterpart, phosphorescence. Luminescence results from the excitation of atomic impurities and defects by an external source. Fluorescence can be excited by ultraviolet, visible, or infrared light, or even X-rays. Fluorescence for long-wave UV light is a characteristic included in diamond grading reports issued by leading gemological laboratories. This article provides a comprehensive overview of the principles, mechanisms, and characteristics of luminescence that create the stunning and memorable brilliance of gemstones. Although diamond is the focus, a variety of colored stones and pearls are also reviewed. This article aims to promote a deeper appreciation of the complexity required to understand these natural wonders.
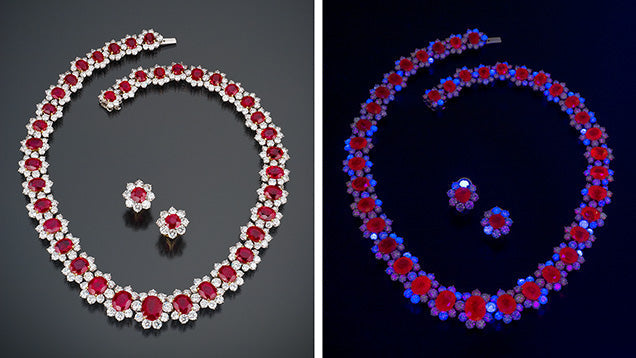
Have you ever wondered why certain materials appear to glow from within when exposed to ultraviolet light? Luminescence, the emission of energy as light following absorption of applied energy, is a fascinating and often beautiful property of many minerals and gemstones (figure 1). Luminescence phenomena can be classified according to the excitation source, as: incident light or photons (photoluminescence, PL), an electron beam (cathodoluminescence), heat (thermoluminescence), electric currents (electroluminescence), and friction (triboluminescence). Luminescence signals can be detected through visual inspection, camera imaging, or spectroscopic means. This review will focus on photoluminescence, further separated into fluorescence or phosphorescence (within gemology defined as during or after excitation, respectively), as well as observations and imaging as routes to explore luminescent defects in gem materials. The luminescence energies or wavelengths (which are inversely proportional to each other) of a properly excited gemstone can reveal a wealth of information regarding its chemical and structural identity and purity. Furthermore, the spatial distribution of luminescence features can elucidate a gemstone’s unique growth and potential treatment history. Although applications to colored stones and pearls will be discussed, diamond will be the primary example presented. The detailed multidisciplinary study of diamond luminescence has captivated gemologists, geologists, and physicists for centuries, since the first observation reported by Robert Boyle in 1664 (Boyle, 1664).
PRINCIPLES OF LUMINESCENCE
A deeper understanding and appreciation of luminescence requires consideration of the electronic states of the species within a material being excited (e.g., a structural defect or impurity) and where they lie in relation to the electronic band structure of the crystal. The electronic band structure of a solid describes the ranges or energy levels that its electrons can have according to the principles of quantum mechanics. This model lays the foundation for explaining many of the electronic and optical properties of insulating and semiconducting materials, such as gemstones.

Diamond, for example, consists of carbon atoms in a tetrahedral configuration, with each atom covalently bonded to four neighboring atoms. The interaction between the carbon atoms results in the characteristic electronic band structure of diamond, illustrated in Figure 2. The outermost electrons of the carbon atoms that are involved in chemical bonding occupy the valence band, which is separated from the empty and electronically permitted conduction band by the forbidden band gap, with energy E g . Diamond is classified as an insulator or a wide-band-gap semiconductor with an indirect band gap energy E g ~5.49 eV (Clark et al., 1964)—practically too wide to conduct by thermal energy alone. However, if an electron in a perfect, flawless diamond is exposed to light with energy > E g , the electron pair bonds can be successfully broken and the electron can be excited into the conduction band, resulting in intrinsic edge absorption (Collins, 1992, 1993; Green et al., 2022). The excited electron leaves behind a hole in the valence band, conceptually a positively charged electron void. Together, the electron-hole pair is known as an exciton and can move through the crystal as a unit. As the electron de-excites back into the valence band, it releases energy in the form of a photon—that is, creating luminescence and recombining with the hole. Because diamond is an indirect semiconductor, excitation of electrons into the lowest energy level of the conduction band also involves lattice vibrational waves known as phonons, which are affected by the temperature of the sample (Collins et al., 1990a; Collins, 1993; Barjon, 2017). The loss of energy through non-radiative processes means that the emitted light has a lower energy E (i.e., longer wavelength λ) than the light that was originally absorbed. In this ideal, defect-free diamond, the resulting emitted light is its intrinsic edge emission (Collins, 1992, 1993; Barjon, 2017).
Luminescence becomes significantly more interesting—and informative—if we move away from a perfect crystal. Crystalline gemstones can contain a variety of atomic-scale irregularities, scientifically termed point defects , in their crystal lattice due to their unique formation and post-growth environmental histories. For diamond, these point defects include missing carbon atoms (vacancies), displaced atoms (interstitials), and impurity complexes based on elements such as nitrogen, boron, nickel, silicon, and hydrogen. Extended defects, such as dislocations, also exist. Their presence disrupts the host lattice, introducing additional energy levels within the band gap (Figure 2). Defects introduce alternative relaxation pathways upon exposure to excitation energies above the band gap, leading to extrinsic emission at characteristic energies that allow the defects to be identified. Furthermore, these defects open the possibility that incident light with energies lower than the band gap energy (longer wavelengths) can be absorbed and subsequently emitted if the photon energy is within the absorption band of a defect. Thus, diamonds with defects can support vibronic transitions of electrons—combining vibrational and electronic interactions—between the valence band, the defect energy levels, and the conduction band, leading to a rich combination of absorption and luminescence features (Collins, 1992, 1993).
In colored stones such as rubies, sapphires, and emeralds, it is the trace electrons of metal ions (e.g., Cr 3+ , V 3+ , and/or Mn 3+/2+ ) or rare earth elements in the host lattice that are excited and subsequently luminescent (Fritsch and Waychunas, 1994; Ponahlo, 2000; Waychunas and Kempe, 2024). They are often referred to as activators. In some cases, sensitizers or coactivators, such as Pb 2+ for Mn 2+ , facilitate fluorescence by strongly absorbing incident light and transferring the energy to the activator. Waychunas and Kempe (2024) provide a detailed review of activators, sensitizers, and electron defects and their roles in mineral luminescence.

The spectroscopic signatures of these luminescence features for diamonds and other gemstones have been tabulated and described in numerous publications (e.g., Collins, 1982, 1992; Ponahlo, 2000; Zaitsev, 2001; Gaft and Panczer, 2013; Luo and Breeding, 2013; Shigley and Breeding, 2013; Gaft et al., 2015; Green et al., 2022; Zhang and Shen, 2023). Identifying the structural defects associated with these features is a nontrivial matter that combines rigorous experimental and theoretical work that can span several decades. Importantly, correlation does not imply causation . Somewhat confusingly, features may be referred to by their most recognizable energy or wavelength of absorption or emission (usually the zero-phonon line [ZPL] for vibronic defects), by a nickname, or by their structural identity (if determined). For example, the blue luminescence of diamond is often associated with the N3 defect (as illustrated in Figure 1) (Clark et al., 1956). It is characterized by a ZPL at 415 nm (2.985 eV), with vibronic structure extending to longer or shorter wavelengths for emission and absorption, respectively (e.g., Davies et al., 1978). During room-temperature luminescence, the N3 vibronic structure—peaking at ~450 nm—dominates (Figure 3), resulting in visible blue emission. The N3 defect has been conclusively identified as three nitrogen atoms surrounding a vacancy, N 3 V 0 (when considering diamond defects, “V” represents a vacancy rather than the element vanadium) (Davies et al., 1978; van Wyk and Loubser, 1993; Green et al., 2017).
When multiple luminescent defect species are present, they can be excited simultaneously, depending on the incident energy. For energies above the band gap (> E g ), emission at defects can be induced by exciton trapping. Spectroscopically, the contribution of each defect can be distinguished. However, during visual or image-based observations, the overlapping luminescence features cannot be separated and instead the combined color is perceived. These contributions can be separated by optical filtering of the emission signal. Deliberate adjustment of the excitation energy can also lead to selective excitation of defects, depending on their energy and absorption structure. If the incident photon energy (< E g ) matches the absorption spectrum of one or more defects, electron excitation can occur at these defects, followed by emission. If the energy does not match the absorption of one or more defect species, these defects will remain inert and the overall luminescence response will be based on that of the other defects present.
While the absorption of light by a defect is proportional to its concentration, the potential presence of other non-radiative relaxation pathways means that the luminescence is only semi-quantitative. A sufficient concentration of the defect must be present for significant absorption of the incident radiation, but subsequent emission may be weak if the energy is transferred non-radiatively to another defect, effectively quenching the luminescence of the defect. For example, the luminescence of N3 (N 3 V 0 ), H3 (N 2 V 0 ), and GR1 (V 0 ) defects in diamond can be quenched by A centers (nitrogen pairs) (Davies and Crossfield, 1973; Crossfield et al., 1974; Thomaz and Davies, 1978; Davies et al., 1987), while the transition metal ions Fe +3 , Fe +2 , Co +2 , and Ni +2 are common quenchers in colored stones (Ponahlo, 2000; Fritsch and Waychunas, 1994; Yu and Clarke, 2002; Waychunas, 2014; Waychunas and Kempe, 2024). Other forms of quenching are concentration quenching, where high concentrations of activators in colored stones result in absorption of fluorescence by neighboring ions of the same species, and thermal quenching, where an increase in temperature results in an increase in lattice vibrations that carry the excitation energy (Fritsch and Waychunas, 1994).
EVOLUTION OF FLUORESCENCE AND PHOSPHORESCENCE OBSERVATION METHODS
In 1852, Irish physicist George Stokes coined the term “fluorescence” to refer to the visible light reaction seen in objects when illuminated by ultraviolet light. In his magnum opus (Stokes, 1852), he added a footnote: “I am almost inclined to coin a word, and call the appearance of fluorescence, from fluor-spar [fluorite], as the analogous term opalescence is derived from the name of a mineral.” The excitation ranges associated with the term expanded over time to encompass short-lived luminescence excited by electromagnetic radiation from X-rays, ultraviolet, visible, and infrared sources. This characteristic is commonly observed in gemstones and minerals, and its measurement has become standard practice in gemology.
Gemologists typically observe fluorescence using longwave (defined as 365 nm emission) and shortwave (254 nm) UV excitations, based on the filtered output of inexpensive and readily available mercury vapor discharge lamps. Unfortunately, the bandpass filters in these portable lights deteriorate over time, allowing additional mercury emissions to pass through and leading to variability in observed fluorescence (Williams, 2007; Pearson, 2011; Luo and Breeding, 2013). Filtering or monochromating the broadband emission from a xenon arc lamp is also an option (e.g., Hainschwang et al., 2013). Currently, longwave and shortwave UV light are often produced for fluorescence applications using LEDs or light-emitting diodes (Luo and Breeding, 2013).
In 1996, De Beers introduced the DiamondView instrument, which illuminates samples using ultrashortwave or deep UV illumination (λ < 225 nm, E > 5.51 eV) generated by filtering the output of a xenon flash lamp (Welbourn et al., 1996). Targeted at diamond, this wavelength results in excitation with energy above the band gap, inducing fluorescence from virtually all diamonds, including those that are inert to both long- and short-wave UV. Because diamond strongly absorbs light with E > E g , fluorescence is generated near the surface of the sample, resulting in sharp patterns that can be used as evidence of the diamond's identity (natural or lab-grown) as well as possible dissolution and treatment, as described later in this paper. In a fully enclosed system, digital fluorescence and phosphorescence images of the sample can be collected under optical or digital magnification (original and current designs, respectively). A selection of optical filters (blue = 390 nm bandpass, green = 475 nm longpass, orange = 550 nm longpass, and red = 725 nm longpass) can be placed in the detection path to restrict the detected wavelengths, allowing closer inspection of the spatial distribution of overlapping emissions. DiamondView quickly established itself as a popular tool for diamond identification, and images collected from it are frequently included in diamond studies. Deep UV fluorescence imaging studies of other gemstone materials are limited, although this energy can effectively excite common fluorescence features and provide the magnification needed to observe their distribution.
UV lamp output can significantly affect the color and intensities of fluorescence and phosphorescence observed for gemstones. Pearson (2011) and Luo and Breeding (2013) present emission spectra for common UV light sources used by the jewelry industry and hobbyists. Observation, whether unaided or using a microscope, should include light filtering through appropriate engineering controls and/or the use of UV goggles to avoid eye and skin damage. Color cameras can be used to capture and securely store fluorescence and phosphorescence images for subsequent analysis. Although most fluorescence testing in gemology today is still based on visual observation and imaging, technological developments and lower equipment costs have made fluorescence spectroscopy a much more widely used tool for rapid analysis (e.g., Hainschwang et al., 2013, 2024; Tsai and D'Haenens-Johansson, 2021; Zhang and Shen, 2023; Tsai et al., 2024).
There have been several compilations of observations of fluorescence and phosphorescence in various gemstones (e.g., Kunz and Baskerville, 1903; De Ment, 1949; Webster, 1983; Fritsch and Waychunas, 1994; Hainschwang et al., 2024). These works established the definitions of fluorescence and phosphorescence still used by gemologists today. That is, fluorescence is “luminescence lasting only during the direct influence of the exciting agent” and phosphorescence is the “emission or propagation of etheric tensions, which affect the optical centers, producing light, white or colored, which persists after the removal of the cause” (Kunz and Baskerville, 1903).
OBSERVATIONS OF FLUORESCENCE AND PHOSPHORESCENCE OF DIAMONDS
Shortwave and Longwave UV-Excited Luminescence of Diamonds. The luminescence of diamonds has long captured the interest of the scientific community and the jewelry industry. One of the first documented cases was by the famous Irish scientist Robert Boyle, who observed that a flash of light was released when a diamond broke, a phenomenon now known as triboluminescence (Boyle, 1664). In 1813, the English mineralogist John Mawe discussed the luminescence of diamonds exposed to sunlight and also to electricity (electroluminescence) (Mawe, 1813). Since then, numerous publications have documented observations of fluorescence and, less commonly, phosphorescence in precious diamonds (e.g., Anderson, 1943; Dyer and Matthews, 1958; Moses et al., 1997; Eaton-Magaña et al., 2007; Luo and Breeding, 2013; Breeding and Eaton-Magaña, 2019).

Among colorless to light yellow natural diamonds on the D to Z scale, approximately 35% fluoresce when exposed to longwave UV light (Moses et al., 1997). Although a rainbow of fluorescence colors is possible, the most common color is blue (97%) due to emission from the N3 defect (N 3 V 0 ), as shown in Figures 1, 3, and 4 (Moses et al., 1997; Luo and Breeding, 2013). Green fluorescence is usually caused by the H4 (ZPL at 496.2 nm, N 4 V 2 0 ) or H3 (ZPL at 503.2 nm, N 2 V 0 ) defects, but can occasionally arise from the nickel–nitrogen-related S2 and S3 defects (ZPLs at 489.2 and 496.7 nm, respectively) (Clark et al., 1956; Collins, 1982, 1992; Eaton-Magaña et al., 2007; Yelisseyev and Kanda, 2007; Luo and Breeding, 2013). An overlapping combination of unidentified broad emission bands in the ~500–700 nm range are responsible for the yellow to orange fluorescence (e.g., Figure 4), most clearly detected in diamonds with 480 nm band absorption and in color-changing “chameleon” diamonds, although notably the fluorescence is not directly caused by the 480 nm band defect (Hainschwang et al., 2005; Eaton-Magaña et al., 2007; Fritsch et al., 2007; Luo and Breeding, 2013; Byrne et al., 2018; Lai et al., 2024). Finally, orange-to-red fluorescence can be produced by NV 0/– defects (ZPLs at 575 and 637 nm, respectively) (Davies and Hamer, 1976; Collins, 1992; Eaton-Magaña et al., 2007; Luo and Breeding, 2013). This list is not exhaustive, and Shigley and Breeding (2013) have provided a convenient diamond defect reference chart showing representative fluorescence images under longwave and deep UV excitations (DiamondView). For natural diamonds, the fluorescence response is generally stronger for longwave UV compared to shortwave UV, although there are exceptions.
The scientific definition of phosphorescence is complex, linked to the lifetime of the luminescence and the types of transitions that produce it (Nasdala and Fritsch, 2024). In practical terms, it is typically considered the emission of light after the excitation is turned off (i.e. an “afterglow”). As a general guide, any emission lasting longer than 100 ns after excitation can be classified as phosphorescence. Most famous examples of natural diamonds are boron-containing type IIb diamonds, which can exhibit chalky blue to green, or rarely red or orange-red, phosphorescence upon exposure to shortwave UV (Eaton-Magaña et al., 2008; Gaillou et al., 2010a). Phosphorescence can last from a few seconds to typically less than a minute, although there are rare natural examples of longer lifetimes (Shen and Eaton-Magaña, 2011). Phosphorescence is produced by two emission bands centered at 500 nm (blue-green) and 660 nm (red); the relative intensities and lifetimes determine the dominant phosphorescence color and its possible color evolution with time (Eaton-Magaña et al., 2008; Gaillou et al., 2010b; Eaton-Magaña and Lu, 2011). The mechanism used to explain the broad blue-green band is donor–acceptor pair (DAP) recombination, where electrons bound to substitutional nitrogen defects (NS0 , the donors) and holes bound to substitutional boron defects (BS0 , the acceptors) are excited by ultraviolet light, emitting phosphorescence as they recombine (Dean, 1965; Watanabe et al., 1997; Eaton-Magaña et al., 2008; Eaton-Magaña and Lu, 2011; Zhao et al., 2023). The detailed origin of the red band remains unexplained. Phosphorescence has also been reported for type I diamonds. Weak yellow and blue phosphorescence can be observed in strongly blue-fluorescent diamonds (N3) (Chandrasekharan, 1946a,b). Yellow phosphorescence upon shortwave UV excitation, with a band centered at 550 nm, is considered a defining characteristic of color-changing “chameleon” diamonds (Hainschwang et al., 2005; Byrne et al., 2018; Lai et al., 2024).
The luminescence behavior of laboratory-grown diamonds produced by high-pressure, high-temperature (HPHT) and chemical vapor deposition (CVD) methods has been studied extensively since their inception in the 1950s. For recent detailed reviews on diamond synthesis using these techniques, see Palyanov et al. (2015), Arnault et al. (2022), and D'Haenens-Johansson et al. (2022). The fluorescence and phosphorescence properties of these diamonds, together with the distributions of associated defects (discussed later in this paper), have been exploited for diamond sorting to separate natural diamonds from lab-grown diamonds, resulting in a variety of device designs and approaches (Welbourn et al., 1996; Martineau et al., 2004; Hainschwang et al., 2013; Lan et al., 2016; Dupuy and Phillips, 2019; McGuinness et al., 2020; Tsai and D'Haenens-Johansson, 2021; Tsai et al., 2024).
Shigley et al. (2004a) and D'Haenens-Johansson et al. (2022) tabulated common fluorescence and phosphorescence characteristics for HPHT-grown diamonds produced with a variety of body colors. Eaton-Magaña et al. (2017) analyzed several thousand HPHT-grown diamonds submitted to GIA from 2007 to 2016 and found that those that fluoresced generally had a stronger reaction to shortwave UV than to longwave UV, in contrast to most naturally fluorescent diamonds. Since the majority of HPHT-grown diamond gemstones on the market today are colorless, including >90% of those submitted to GIA, it is appropriate to highlight their luminescence characteristics here (Eaton-Magaña et al., 2024). Among colorless and near-colorless HPHT-grown diamonds, the vast majority are inert to longwave UV radiation, with a yellow or orange emission if observed, while ~90% show yellow or yellow-green fluorescence to shortwave UV radiation (Eaton-Magaña et al., 2017). Shortwave UV radiation also induces an often strong and long-lasting blue, yellow, or yellow-green phosphorescence that is associated with boron (Watanabe et al., 1997; Eaton-Magaña and Lu, 2011; Zhao et al., 2023). The range of observed phosphorescence colors is influenced by the intensities and lifetimes of a boron-related blue emission band centered at 500 nm and an orange or yellowish-orange emission band whose center can range from 575 to 590 nm (Watanabe et al., 1997; Eaton-Magaña et al., 2008; Eaton-Magaña and Lu, 2011; D'Haenens-Johansson et al., 2015; Zhao et al., 2023). Figure 4 shows an example of the fluorescence and phosphorescence response of a colorless HPHT-grown diamond compared to natural and CVD-grown diamonds. However, it is possible to reduce and even remove phosphorescence through irradiation treatment, leaving screening instruments that rely on this feature vulnerable (Robinson, 2018; Dupuy and Phillips, 2019; Eaton-Magaña et al., 2024).
CVD-grown diamonds dominate the non-melee lab-grown gemstone market; they currently account for ~80% of lab-grown diamond submissions to the GIA (Eaton-Magaña et al., 2024). Of these, ~80% are classified as colorless. To achieve these high colors, CVD-grown diamonds are regularly subjected to HPHT or LPHT (low-pressure, high-temperature) annealing treatments, in which less desirable brown tones are reduced or removed (e.g., Martineau et al., 2004; Meng et al., 2008; Wang et al., 2012; Eaton-Magaña et al., 2021, 2024; D'Haenens-Johansson et al., 2022). These treatments modify the relative concentrations of defects in the material, resulting in changes in fluorescence behavior. Early “as-grown” (untreated) CVD diamonds sometimes fluoresced orange, orange-yellow, or yellow under long- and short-wave UV (with a stronger response for the latter) due to high concentrations of NV 0/– defects (Martineau et al., 2004; Wang et al., 2007). However, as the colors and purity levels of as-grown products have improved, they are now mostly inert under long- and short-wave UV illumination (Eaton-Magaña et al., 2021); see, for example, the sample shown in Figure 4. Decolorizing annealing treatments reduce the relative concentration of NV centers while introducing green fluorescence from H3 defects (N 2 V 0 ) or an unidentified defect with a ZPL at 499 nm and a complex vibronic band centered at ~550 nm; these treatments are most easily detected using shortwave UV (Martineau et al., 2004; Wang et al., 2012; Wassell et al., 2018; McGuinness et al., 2020). Weak blue-green phosphorescence associated with trace amounts of boron can also be introduced (Wang et al., 2012). The fluorescence and phosphorescence behavior for a colorless CVD diamond annealed by HPHT using longwave, shortwave, and deep UV illumination is shown in Figure 4.
Spatial distribution of fluorescent and phosphorescent defects in diamonds: analysis using deep UV. Natural diamond can be pictured as growing out of a nucleating core, supplied with carbon atoms from melts and fluids, deep in the Earth’s mantle at the high temperatures and pressures at which diamond—rather than its allotrope graphite—is stable. Sunagawa (1984) and Harris et al. (2022) have presented comprehensive reviews of natural diamond morphology , or crystal shape. The ideal rough morphology of natural diamond is octahedral: two square-based pyramids connected at the base with {111}-oriented faces. 1 The second most common morphology has well-developed, smoothly curved, irregular square faces that are approximately {100}-oriented. Since these are not true cubic {100} faces, the preferred name for this morphology is cuboid . Diamonds can also exhibit mixed habit growth, although this is rarely observed, developing octahedral and cuboid faces. By the time the diamond is recovered, the external morphology can be dramatically modified through geological processes, leading to rounded and irregular shapes. Furthermore, in the gem trade, the external surfaces are removed through polishing. However, all is not lost: the conditions of the diamond's natural formation, its residence in the mantle, and subsequent transport to the surface combine to leave a mark.
1 In crystallography, the Miller indices h , k , and l are used to mathematically define crystal planes and directions, enclosed by different forms of brackets and parentheses. Briefly, the notation is as follows: { hkl } represents planes that are symmetrically equivalent to a specific plane ( hkl ). [ hkl ] is a specific direction perpendicular to ( hkl ), while < hkl > is a group of directions that are equivalent to [ hkl ] by symmetry. For diamond, the main crystallographic faces are the {111} octahedral, {100} cubic, and {110} dodecahedral faces.
Diamond growth progresses through a series of episodes, experiencing changes in the growth environment and the composition of the source fluid. Furthermore, diamonds can potentially go through periods during which their surfaces are attacked by aggressive fluids, removing atoms and leading to crystal dissolution and resorption (Fedortchouk, 2019; Fedortchouk et al., 2019; Smit and Shirey, 2020; Harris et al., 2022). Diamonds can also undergo plastic deformation, introducing extended defects such as dislocations and slip planes (Evans and Wild, 1965; Willems et al., 2006; Laidlaw et al., 2020, 2021). As a result, the distributions, combinations, and relative concentrations of defects present in the crystal are heterogeneous, and each diamond has a unique and complex internal growth structure that reveals a fascinating history. We can think of these patterns as analogous to the growth rings present in the trunk of a tree, with variations caused by cyclical environmental changes, as well as stressful conditions such as disease or insect infestations.
Because many diamond defects are luminescent, their distribution can be observed by fluorescence and phosphorescence, as well as by electron beam-excited cathodoluminescence imaging (e.g., Welbourn et al., 1996; Harris et al., 2022). Although the growth structure can occasionally be discerned by long- or short-wave UV illumination, the preferred excitation energy of incident photons is higher than the bandgap energy of diamond, here termed deep UV, resulting in specific emission from the surface of virtually all diamonds (Welbourn et al., 1996). The characteristic fluorescence colors associated with specific luminescent defects described in the previous section remain unchanged, although emission efficiency is generally improved using deep UV illumination. Furthermore, deep UV illumination is capable of exciting blue-to-green “A-band” emission (Dean, 1965; Ruan et al., 1992; Green et al., 2022). Recent high-resolution multi-technique studies by Laidlaw et al. (2020, 2021) have shown that A-band originates from unidentified defects in the material adjacent to dislocations and grain boundaries, which themselves act as non-radiative recombination centers (i.e., are dark). Importantly, the fundamental growth structure of a diamond, whether natural or lab-grown, cannot be altered by treatment, although the fluorescent colors can potentially be modified.


Ingrowth patterns associated with natural octahedral diamond growth appear as a series of concentric squares or rectangles with variable luminescence, as shown in Figure 5 (e.g., Welbourn et al., 1996; Harris et al., 2022). Depending on the crystallographic orientations of the facets of a polished diamond and the viewing angle, the pattern may deviate from this ideal and appear truncated. Figure 6 shows a selection of natural diamond fluorescence patterns collected under deep UV illumination. Cuboidal growth introduces curved and irregular growth horizons (Figure 6A; Moore and Lang, 1972; Lang, 1974, 1979; Suzuki and Lang, 1976; Welbourn et al., 1989; Harris et al., 2022). Ingrowth patterns in natural diamond can sometimes be highly irregular or show multiple nucleation sites (Figure 6B). Furthermore, plastic deformation can introduce luminescent glide planes or dislocations (Figure 6, C and D). Luminescence patterns in high-purity type IIa and type IIb boron-bearing diamonds are typically dominated by polygonal dislocation lattices (e.g., Hanley et al., 1977; De Corte et al., 2006; Smith et al., 2016, 2017; Smith, 2023), often emitting blue A-band emission (Figure 6E). High levels of natural irradiation can create structural damage to the diamond lattice, quenching the luminescence, resulting in localized dark regions in fluorescence images, as shown in Figure 6F (Schulze and Nasdala, 2016; Breeding et al., 2018; Smit et al., 2018; Breeding and Eaton-Magaña, 2019). Diamonds that phosphoresce under conventional UV excitation wavelengths, such as type IIb diamonds (e.g., Figure 7), also phosphoresce under deep UV (e.g., Gaillou et al., 2010a; Eaton-Magaña and Lu, 2011; Eaton-Magaña et al., 2018). The response is typically more pronounced. With practice, these patterns can be recognized as natural, although supplementary data are occasionally required for conclusive identification. Notably, treatments may or may not create changes in fluorescence or phosphorescence colors depending on the starting material and treatment recipe (e.g., Hainschwang et al., 2008, 2009; Nasdala et al., 2013; Eaton-Magaña and Ardon, 2016; Wang et al., 2018; Breeding and Eaton-Magaña, 2019; Eaton-Magaña, 2020). Due to this variability, discussion is beyond the scope of this article.

The growth morphology of HPHT-grown diamonds is typically cuboctahedral, with well-developed cubic {100} and octahedral {111} faces, and smaller dodecahedral {110} and trapezohedral {113} faces (illustrated in Figure 8), the equilibrium of which can be affected by growth temperatures (Strong and Chrenko, 1971; Kanda et al., 1980, 1989; Sunagawa, 1984, 1995; Satoh et al., 1990; Burns et al., 1999; Sumiya et al., 2002; D'Haenens-Johansson et al., 2022). Impurity adsorption is strongly sector dependent and sensitive to growth rates and temperatures (Strong and Chrenko, 1971; Burns et al., 1990, 1999; Satoh et al., 1990; Kiflawi et al., 2002). Boron concentrations are typically highest in the {111} growth sectors, followed by the {110} sectors; nitrogen concentrations follow a different order: {111} > {100} > {113} > {110} (Burns et al., 1990). Incorporation of nickel- and cobalt-related defects is also sector dependent (Collins et al., 1990b; Lawson et al., 1996).
In fancy-colored HPHT-grown diamonds, the cuboctahedral distribution of defects can be discernible under visible, shortwave UV, and/or longwave UV light (e.g., Shigley et al., 2004a,b). Using deep UV, the characteristic cuboctahedral growth patterns are enhanced (Figure 8); this feature was largely the driving force for the development of the DiamondView instrument for diamond identification (Welbourn et al., 1996). Fluorescence colors depend on defect concentration, as summarized by Eaton-Magaña et al. (2017) and D'Haenens-Johansson et al. (2022). Colorless type II specimens fluoresce blue-green to blue-green, followed by remarkably long-lived blue-green (500 nm band) and/or orange-yellow (575 nm) phosphorescence, as shown in Figure 8 (Watanabe et al., 1997; Eaton-Magaña et al., 2008, 2017; Eaton-Magaña and Lu, 2011; D'Haenens-Johansson et al., 2014, 2015; Zhao et al., 2023). The combination of characteristic growth zonation, fluorescence color, and phosphorescence is recognizably different from what is observed for similarly colored natural and CVD-grown diamonds, making this a powerful technique for differentiating between HPHT-grown and other diamond materials.

The CVD growth method is based on careful control of the gas-phase chemistry of a carbon-containing plasma that has been activated by an energy source (typically microwaves), leading to the deposition of diamond on diamond seeds that act as a template for crystal growth. High-quality CVD diamond deposition typically occurs on (001)-oriented diamond seeds (also called substrates), following what is known as “stepwise flow growth,” with microscopic riser and terrace segments oriented along the [001] and [101] directions, respectively (Martineau et al., 2004; 2009). The resulting idealized layer-by-layer deposition produces a crystal with a cubic growth morphology. The different absorption of impurities in the risers and terraces results in a heterogeneous incorporation of defects, creating a characteristic fluorescence pattern of closely spaced striations that can be observed by deep UV illumination (Figure 9) (Martineau et al., 2004, 2009). Furthermore, any modifications in the growth conditions, whether unintentional or caused by planned disruptions, result in changes in the defect content in a plane parallel to the substrate, creating a layered appearance that depends on the viewing angle. This is a feature frequently observed in deep UV fluorescence images for large CVD-grown diamonds, providing clear evidence that they are produced via multi-stage growth (e.g., Dieck et al., 2015; Law and Wang, 2016; Tam and Poon, 2023; Eaton-Magaña et al., 2024). Dislocations and bundles of blue-fluorescent threads can also be observed, oriented in a direction approximately parallel to the main macroscopic growth direction, with deviations caused by growth in stepped flow (Martineau et al., 2004, 2009). Notably, these dislocations can have a recognizable linear appearance when viewed along directions that cross the growth planes, but can appear irregular and almost polygonal when the viewing angle is parallel to the main growth direction (Martineau et al., 2004, 2009; Dieck et al., 2015).

Fluorescence colors can span the entire visible spectrum, even for colorless samples. CVD-grown diamonds typically show red, orange, or pink fluorescence colors from NV 0 defects , while the fluorescence colors of these nitrogen-containing CVD diamonds progress from yellow to green and turquoise with higher annealing temperatures (Martineau et al., 2004; Wang et al., 2012; Eaton-Magaña and Shigley, 2016; Wassell et al., 2018). Many annealed CVD diamonds also show blue-green phosphorescence (e.g., Wang et al., 2012). Eaton-Magaña and Myagkaya (2024) recently compared the changes in deep-UV images for a CVD-grown diamond that was subjected to GIA before and after HPHT annealing (Figure 10). Deep UV fluorescence images illustrate changes in the concentration of luminescent defects, highlighting that the intrinsic growth pattern of the sample, characteristic of multi-stage CVD growth, was not affected. CVD-grown diamonds that have been treated to produce blue, pink, or yellow body colors exhibit similar characteristic patterns but different fluorescent colors depending on the defect content of the starting material and the treatment sequence (e.g., Wang et al., 2010; Moe et al., 2015; Eaton-Magaña and Shigley, 2016; Johnson et al., 2023).
Deep UV imaging has also proven to be an invaluable tool in detecting rare CVD diamonds that are grown on natural diamonds, creating a “hybrid” natural/lab-grown diamond product (Fritsch and Phelps, 1993; Moe et al., 2017; Tang et al., 2018; Ardon and McElhenny, 2019). These examples were apparently produced to increase the weight of the sample or to create a potentially more valuable color, such as the blue hues introduced by type IIb CVD overgrowth layers. When exposed to deep UV, the hybrid diamonds studied to date have shown distinct fluorescence patterns. The natural regions fluoresce blue due to N3 defects, while the CVD layers fluoresce red due to high concentrations of NV 0 or, for cases of type IIb diamond deposition, fluoresce blue-green with similarly colored phosphorescence.
FLUORESCENCE AND PHOSPHORESCENCE BEHAVIOR OF OTHER PRECIOUS STONES
Corundum. Lecoq de Boisbaudran (1887) demonstrated that pure alumina (i.e. corundum) was not luminescent, but showed a red luminescence after doping with a small amount of chromium. This observation was later confirmed by several other researchers, including Nichols and Howes (1929). The red luminescence of Cr 3+ seen in ruby (e.g., Figure 1) has been the subject of extensive research in the scientific and gemological literature (Ponahlo, 2000; Fritsch and Waychunas, 1994; Gaft and Panczer, 2013; Gaft et al., 2015). Ruby lasers, for example, are based on the emission of chromium at 692.9 and 694.3 nm. Although this luminescence is commonly referred to as “fluorescence” in gemology and elsewhere, the excitation pathway for this feature means that it should technically be classified as phosphorescence (Nasdala and Fritsch, 2024).

Fluorescence can be a useful tool for separating natural from synthetic rubies and identifying heat treatment in some rubies and sapphires (Hainschwang et al., 2013, 2024; Hughes et al., 2017; Mauthner, 2020). For example, synthetic rubies are generally more strongly fluorescent than many natural rubies, as they are generally iron-free. Synthetic rubies typically have strong red chromium-related fluorescence in longwave UV and moderate to strong red fluorescence in shortwave UV. However, low-iron rubies from marble deposits, such as Myanmar, can show similar fluorescence intensities. Therefore, this test can support a natural versus synthetic determination, but is insufficient on its own to completely separate these materials. Shortwave and deep UV excitation can also provide insights into the growth structure of corundum. For example, they can enhance the characteristic curved bands in flame-fused synthetic sapphire, as shown in Figure 11, which differ markedly from the angular growth patterns in natural stones (Hughes et al., 2017; Hughes, 2019; Zandi, 2021; Sohrabi and Anjomani, 2022; Hainschwang et al., 2024).

Fluorescence observations can also be useful for identifying heat treatment. Many heat-treated low-iron sapphires and rubies show a chalky blue fluorescence under shortwave UV (Figure 12) (Hughes and Emmett, 2005; Hughes et al., 2017; Hughes and Perkins, 2019; Hughes and Vertriest, 2022; Hainschwang et al., 2024). However, careful observation is required, as the red fluorescence of Cr 3+ can mask the chalky fluorescence (Mauthner, 2020). Notably, synthetic ruby and sapphire often also exhibit this chalky fluorescence, although it can be masked by the red fluorescence in some synthetic rubies. This bluish fluorescence usually occurs in the wavelength range of 410–420 nm and is attributed to the charge transfer transition O 2– → Ti 4+ (Evans, 1994; Wong et al., 1995a,b; Tsai et al., 2024). Upon heating, the exsolved rutile (TiO 2 ) in corundum undergoes dissolution, creating Ti 4+ ions and Ti-Al vacancies. The blueish chalky fluorescence coincides with rutile-bearing zones, but can be quenched by high iron concentrations (Hughes et al., 2017; Hughes and Perkins, 2019). This chalky reaction in heated corundum is almost never detected in natural corundum and was first documented by Crowningshield (1966, 1970). However, an inert reaction does not confirm that the stone is not heated, as the fluorescence bands can be destroyed at annealing temperatures above ~1500°C. The chalky reaction may be enhanced if observed under deep UV compared to shortwave UV illumination, and it is possible that it may reveal lower temperature annealing treatments (Hughes and Perkins, 2019).

Fracture filling and coatings in colored stones. Although used much less commonly for colored stones than for diamonds, deep UV fluorescence has proven useful for revealing different types of fracture filling materials and potentially for estimating the degree of clarity enhancement. For example, surface-reaching glass filler in clarity-enhanced rubies can fluoresce blue, in sharp contrast to the red Cr 3+ emission from the host (Lai, 2018a). Filtering the emission signal using a blue bandpass filter reduces the intensity of the red background emission, making it easier to detect filler fluorescence. Similar results have been found for emeralds that have had their clarity enhanced with epoxy resin fillers or oils, with the color of the fluorescence providing clues to the identity of the filler (Notari et al., 2002; Hainschwang et al., 2013; Droux and Fritsch, 2015; Lai, 2018b; Gaievskyi, 2022). Fluorescence from fillers can also be observed in emeralds using longwave UV illumination due to the mineral’s often weak to undetectable Cr 3+ fluorescence , as shown in Figure 13 (e.g., Tsai, 2021). Untreated jadeite is typically inert, but fluorescence testing can provide evidence of coating, dyeing, and impregnation (Lu, 2012; Zhang and Shen, 2023). Waxes and epoxy resins used to impregnate jadeite can fluoresce blue under longwave UV illumination (Lai, 2016, 2018c); the response may be more pronounced using deep UV excitation, with epoxy resin forming a complex, web-like fluorescence pattern. Coated jadeite can also be identified by differences in color and fluorescence intensity between the coating and any exposed jadeite (Zhang et al., 2013).
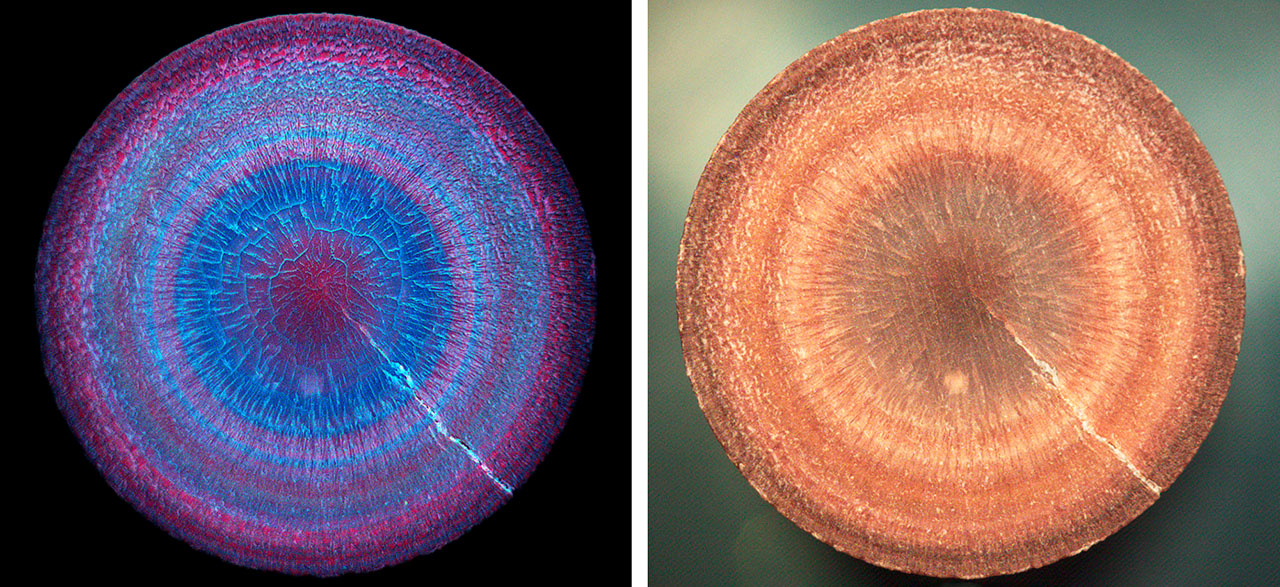
Pearls. Pearls are organic gemstones produced by several species of saltwater and freshwater molluscs, with radial layers consisting of calcium carbonate crystals held together by an organic matrix mixture that is often called conchiolin. Most are nacreous, where the calcium carbonate is in the form of aragonite platelets, while the less common non-nacreous pearls have a different aragonite structure or, in some cases, are composed of calcite instead of aragonite (figure 14). Pearls may be natural or cultured and may undergo a number of treatments to improve their appearance, including dyeing, bleaching, optical brightening, irradiation, or maeshori luster enhancement .
UV fluorescence analysis of pearls is neither straightforward nor conclusive (Fritsch and Waychunas, 1994). Pearls can fluoresce under longwave UV with a rainbow of colors and intensities that are influenced by several factors, including treatments and body color intensity (Elen, 2001; Kiefert et al., 2004; Wang et al., 2006; Sturman et al., 2014, 2019; Zhou et al., 2012, 2016, 2020, 2021; Tsai and Zhou, 2021). Generally, darker or more saturated colors fluoresce weaker. Untreated white to cream-colored pearls typically fluoresce blue or blue-green, but processed pearls such as akoya and cultured freshwater pearls may fluoresce a strong bluish white (Zhou et al., 2020). Strong bluish fluorescence under long-wave UV also raises the suspicion that a pearl has undergone optical bleaching, where an optical brightening agent (OBA) has been added to neutralize less valuable yellow hues by intensifying or introducing blue fluorescence (~430 nm) (Zhou et al., 2020, 2021). Fluorescence from OBAs is not as efficiently excited by short-wave UV. However, shortwave UV can induce fluorescence from the naturally occurring amino acid tryptophan (Trp or W) that is present in pearl nacre, and its intensity can be reduced by color and processing treatments (Tsai and Zhou, 2021; Tsai et al., 2024). Because its emission is centered at ~340 nm, with a longer-wavelength tail terminating at ~450 nm, its fluorescence is only weakly blue and difficult to detect visually.
The range of fluorescence behaviors observed for pearls and their overlapping emissions makes visual analysis challenging. Fluorescence spectroscopy using different excitation sources shows promise for gemological applications as it allows the separation and identification of fluorescent components, although a comprehensive assessment still requires multi-technique analysis (Miyoshi et al., 1987; Miyoshi, 1992; Iwahashi and Akamatsu, 1994; Ju et al., 2011; Shi et al., 2018; Zhou et al., 2016, 2020, 2021; Tsai and Zhou, 2021; Tsai et al., 2024).
CONCLUSIONS
Luminescence analysis can shed much light on the history of a gemstone and whether it is natural, lab-grown or treated. Luminescence arises from impurities and defect structures in the crystal lattice and can be detected even at concentrations as low as a few parts per billion. Photoluminescence-based imaging methods, comprising fluorescence and phosphorescence, are particularly powerful analytical tools because they reveal characteristic luminescent defect distributions using simple sources of ultraviolet light. This has made it a valuable technique for gemologists and scientists.
For example, the distribution of luminescent defects in gem diamonds can help distinguish between natural and lab-grown crystals. It can also provide clues as to any post-growth processes the diamond may have undergone, either naturally or through artificial treatment. Phosphorescence is rare enough in natural diamonds that any phosphorescent diamond must be fully analyzed to determine its method of formation. Although most commonly used for diamond research, investigations of fluorescence and phosphorescence of other gemstones are also abundant.
Natural and synthetic growth structures for other materials, including corundum and pearls, have also been revealed under UV illumination. Furthermore, any treatments applied to these gemstones can alter their fluorescence. Coatings, dyes, and fracture fillings of corundum, emerald, and jade can be highlighted using fluorescence imaging, as these foreign substances have fluorescence responses that differ from the host gemstone. A deeper understanding of fluorescent materials and their corresponding spectra has resulted in important advances in instrumentation, optimizing illumination wavelengths to selectively enhance certain characteristics. Consequently, luminescence imaging has become an indispensable tool for materials analysis, one that is routinely used in gemological laboratories. The largely straightforward interpretation of the fluorescence and phosphorescence behaviors of gemstones, together with their distinctive patterns, makes these techniques valuable to those in the trade as well. The low cost and ease of operation of fluorescence and phosphorescence imaging systems compared to alternative luminescence techniques such as cathodoluminescence further enhance their accessibility and appeal.